An infographic created by Wolters Kluwer and CT Corporation has revealed the top characteristics of the most successful rewards-based crowdfunding campaigns over the last 12 months.
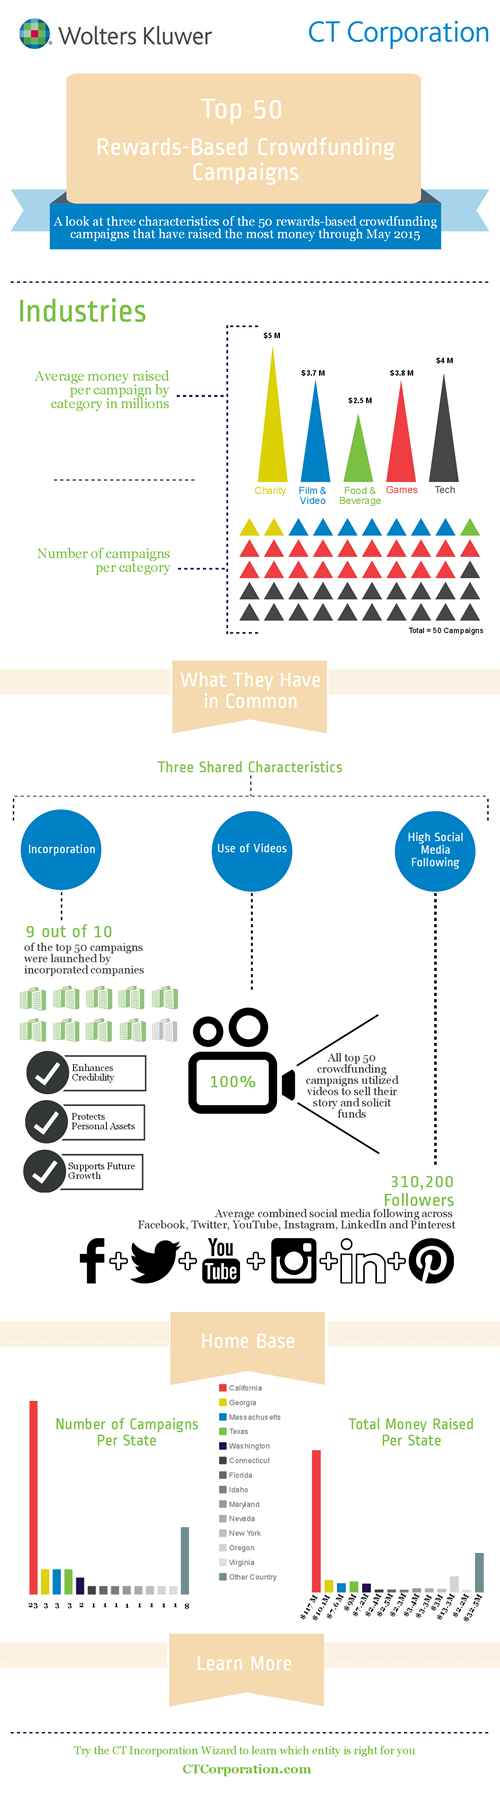
Technology raised the second most amount of money per campaign after charities, which gained an average of $5m per campaign, next to $4m for technology-led products and services.
However, fewer campaigns were run for charities, while the technology market was a little more popular, taking around 42 per cent of all crowdfunding campaigns vs four per cent that were charitable causes.
Wolters Kluwer and CT Corporation analysed the top 50 campaigns on rewards-based crowdfunding platforms to see how they managed to raise so much money and it uncovered three very obvious trends: incorporation, video and social media.
Incorporation
Nine out of ten of the most successful campaigns were launched by incorporated companies, which, to investors, would offer some protection for their investments and therefore peace of mind. Additionally, for the companies involved, incorporations have certain benefits, such as better loans, grants and contracts that mean they were in a better position to tout their wares on a crowdfunding platform, with extra security against losses themselves.
Video
Every single campaign included in Wolters Kluwer and CT Corporation’s list had a video accompanying their campaign. This adds a certain amount of professionalism, again, making the campaign seem more trustworthy. Whether portraying the company’s story or simply showcasing the product, it shows dedication from the company, demonstrating they are willing to invest time and money in creating effective assets to accompany their campaign.
Social Media
In total, the companies behind the 50 campaigns had 310,200 social media followers, which allowed them to drum up interest in their product. The key social networks the leaders were active on were Facebook, Twitter, YouTube, Instagram, LinkedIn and Pinterest.
Take a look at the full infographic below.